Drag
Swipe
Close
View
Prismic Reflections
Dashboard Design & Data Visualisation

We see data as design & design as impact.

50+ Dashboards Designed
Ellipse
20+ Years
Ellipse
10+ Awards
Ellipse
50+ Dashboards Designed
Ellipse
20+ Years
Ellipse
10+ Awards
Ellipse
50+ Dashboards Designed
Ellipse
20+ Years
Ellipse
10+ Awards
Ellipse
50+ Dashboards Designed
Ellipse
20+ Years
Ellipse
10+ Awards
Ellipse
50+ Dashboards Designed
Ellipse
20+ Years
Ellipse
10+ Awards
Ellipse

Trusted by leading brands worldwide

Data design experiences that unveil hidden insights

Data Complexity

Transforming vast, scattered data into structured, actionable insights

Real-Time Data Updates

Integrating live data feeds for continuous updates efficiently

Insightful Data Design

Crafting visually compelling and insightful representations of data

Customization & Scalability

Building adaptive frameworks that grow and evolve with business needs

cross platform

Performance Optimization

Applying cutting-edge techniques to handle massive datasets with speed and efficiency

User Experience

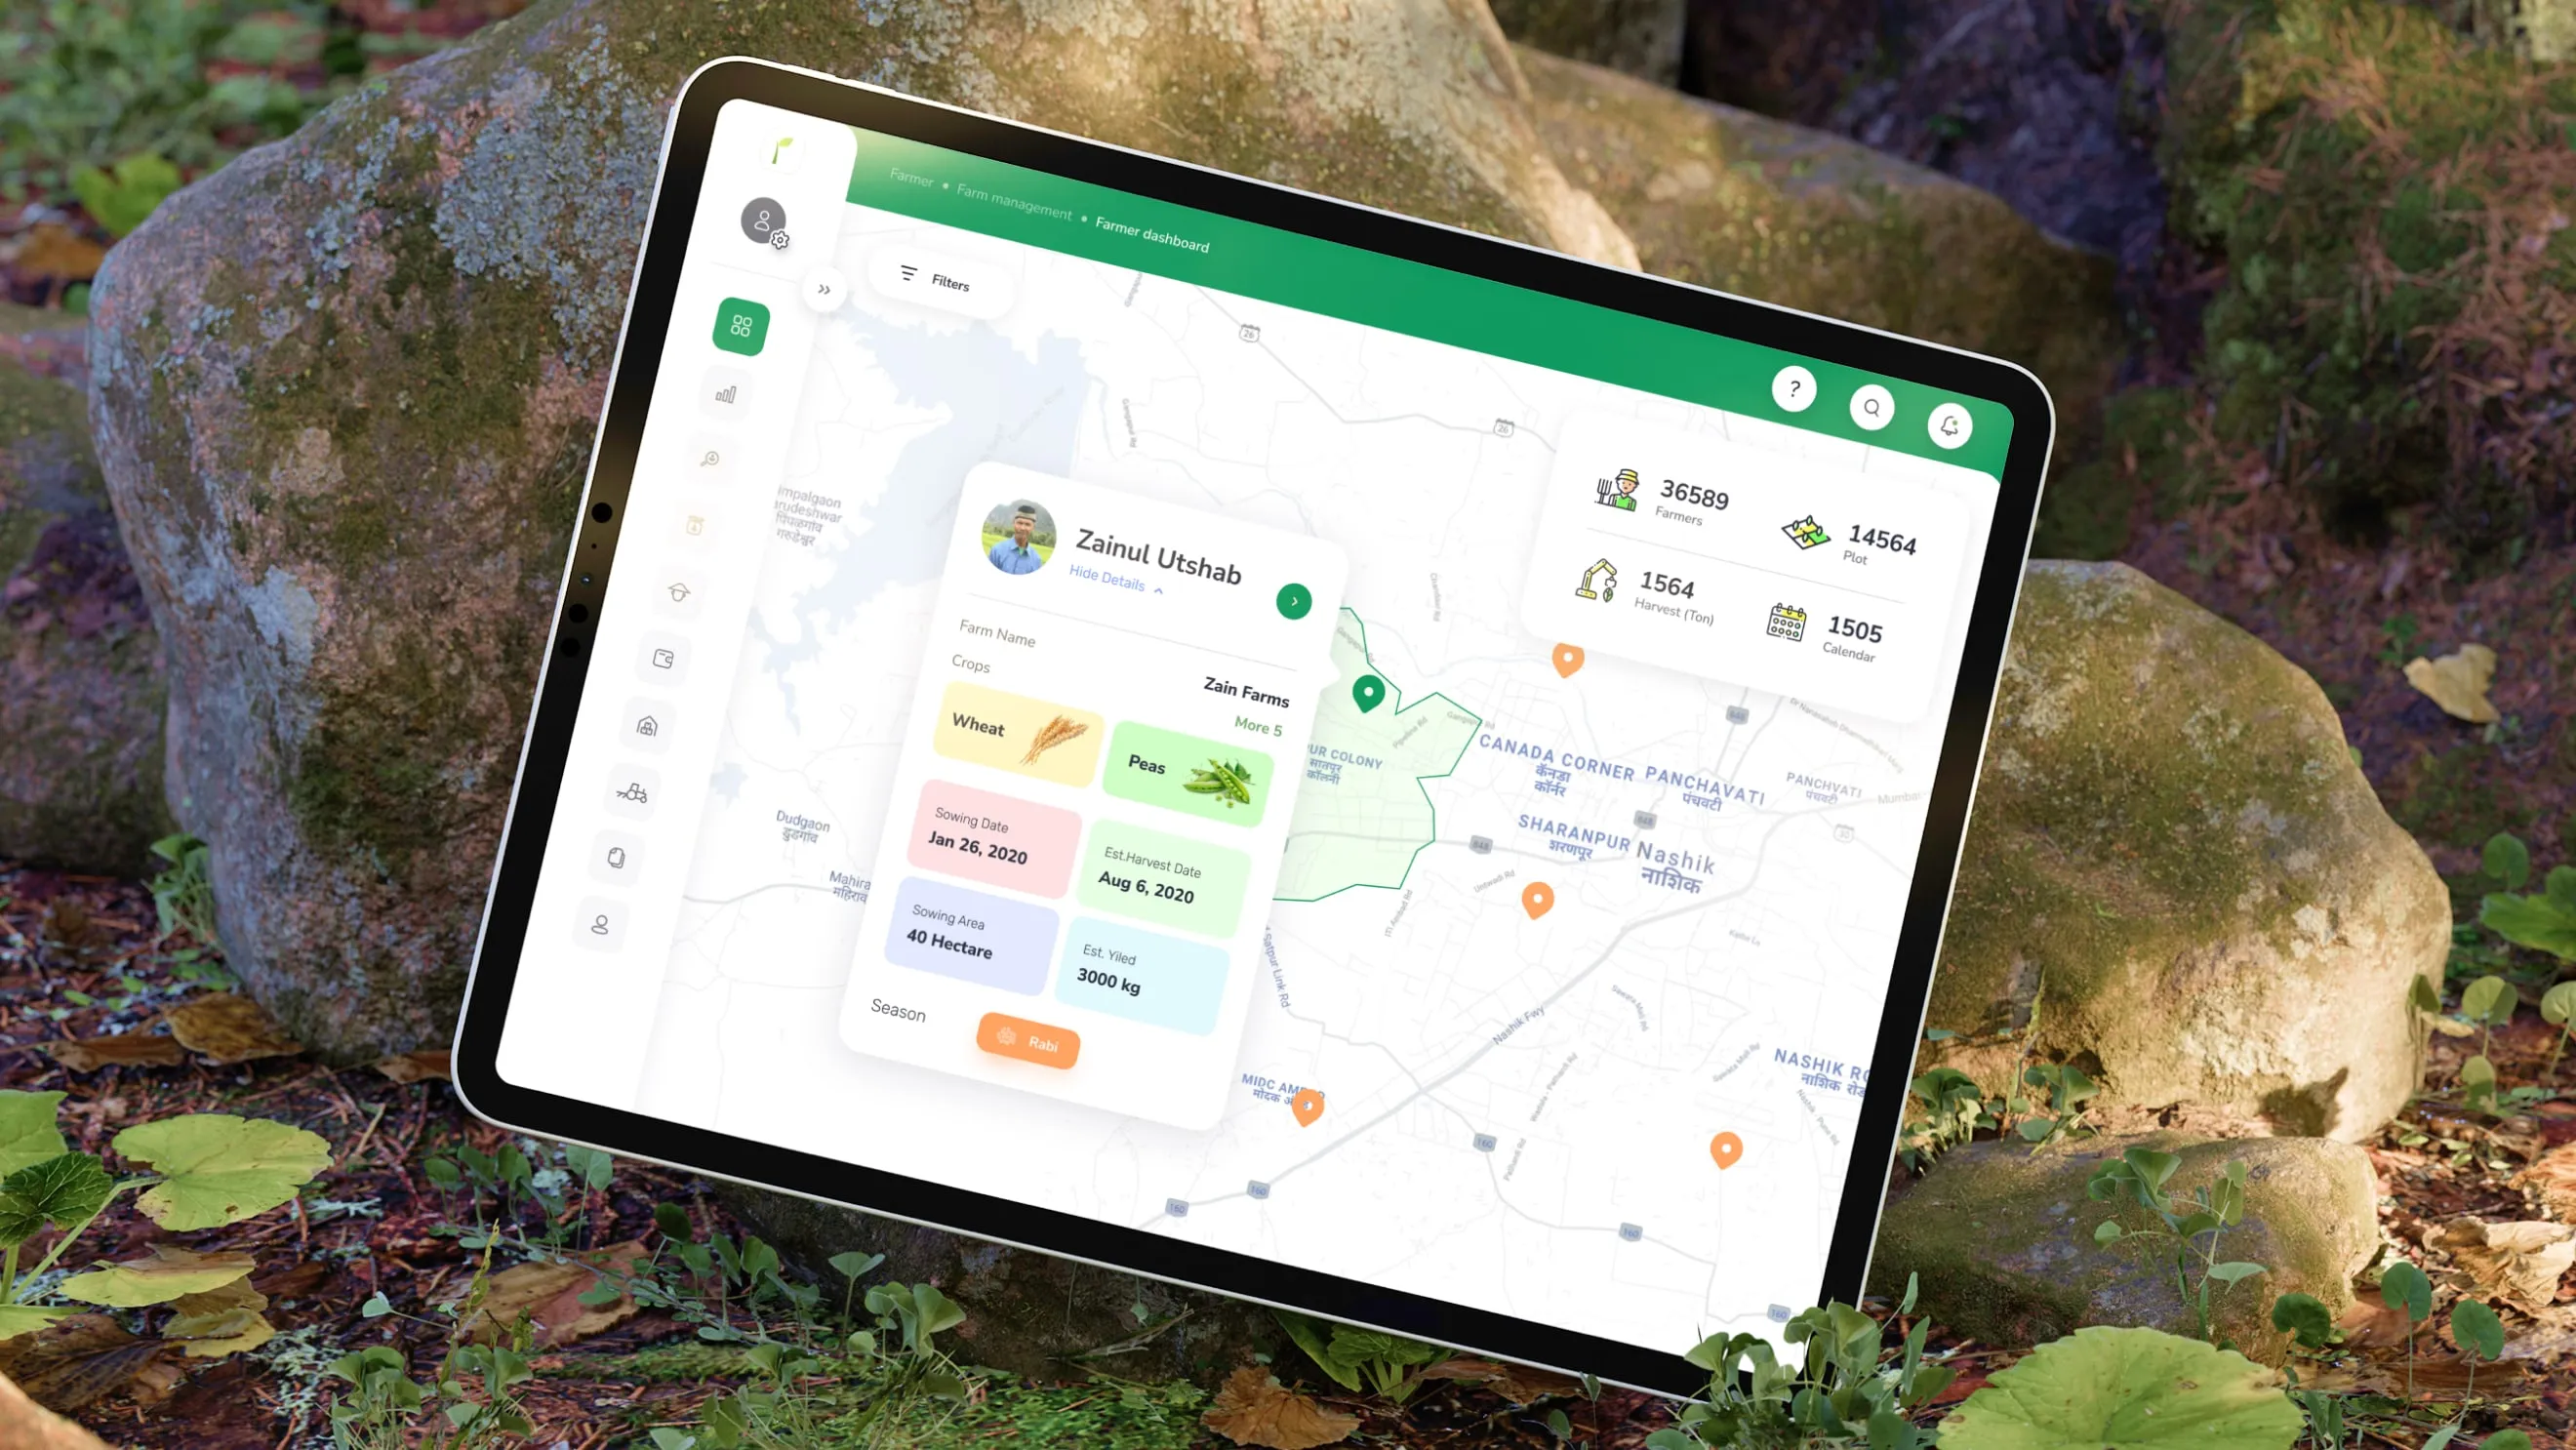
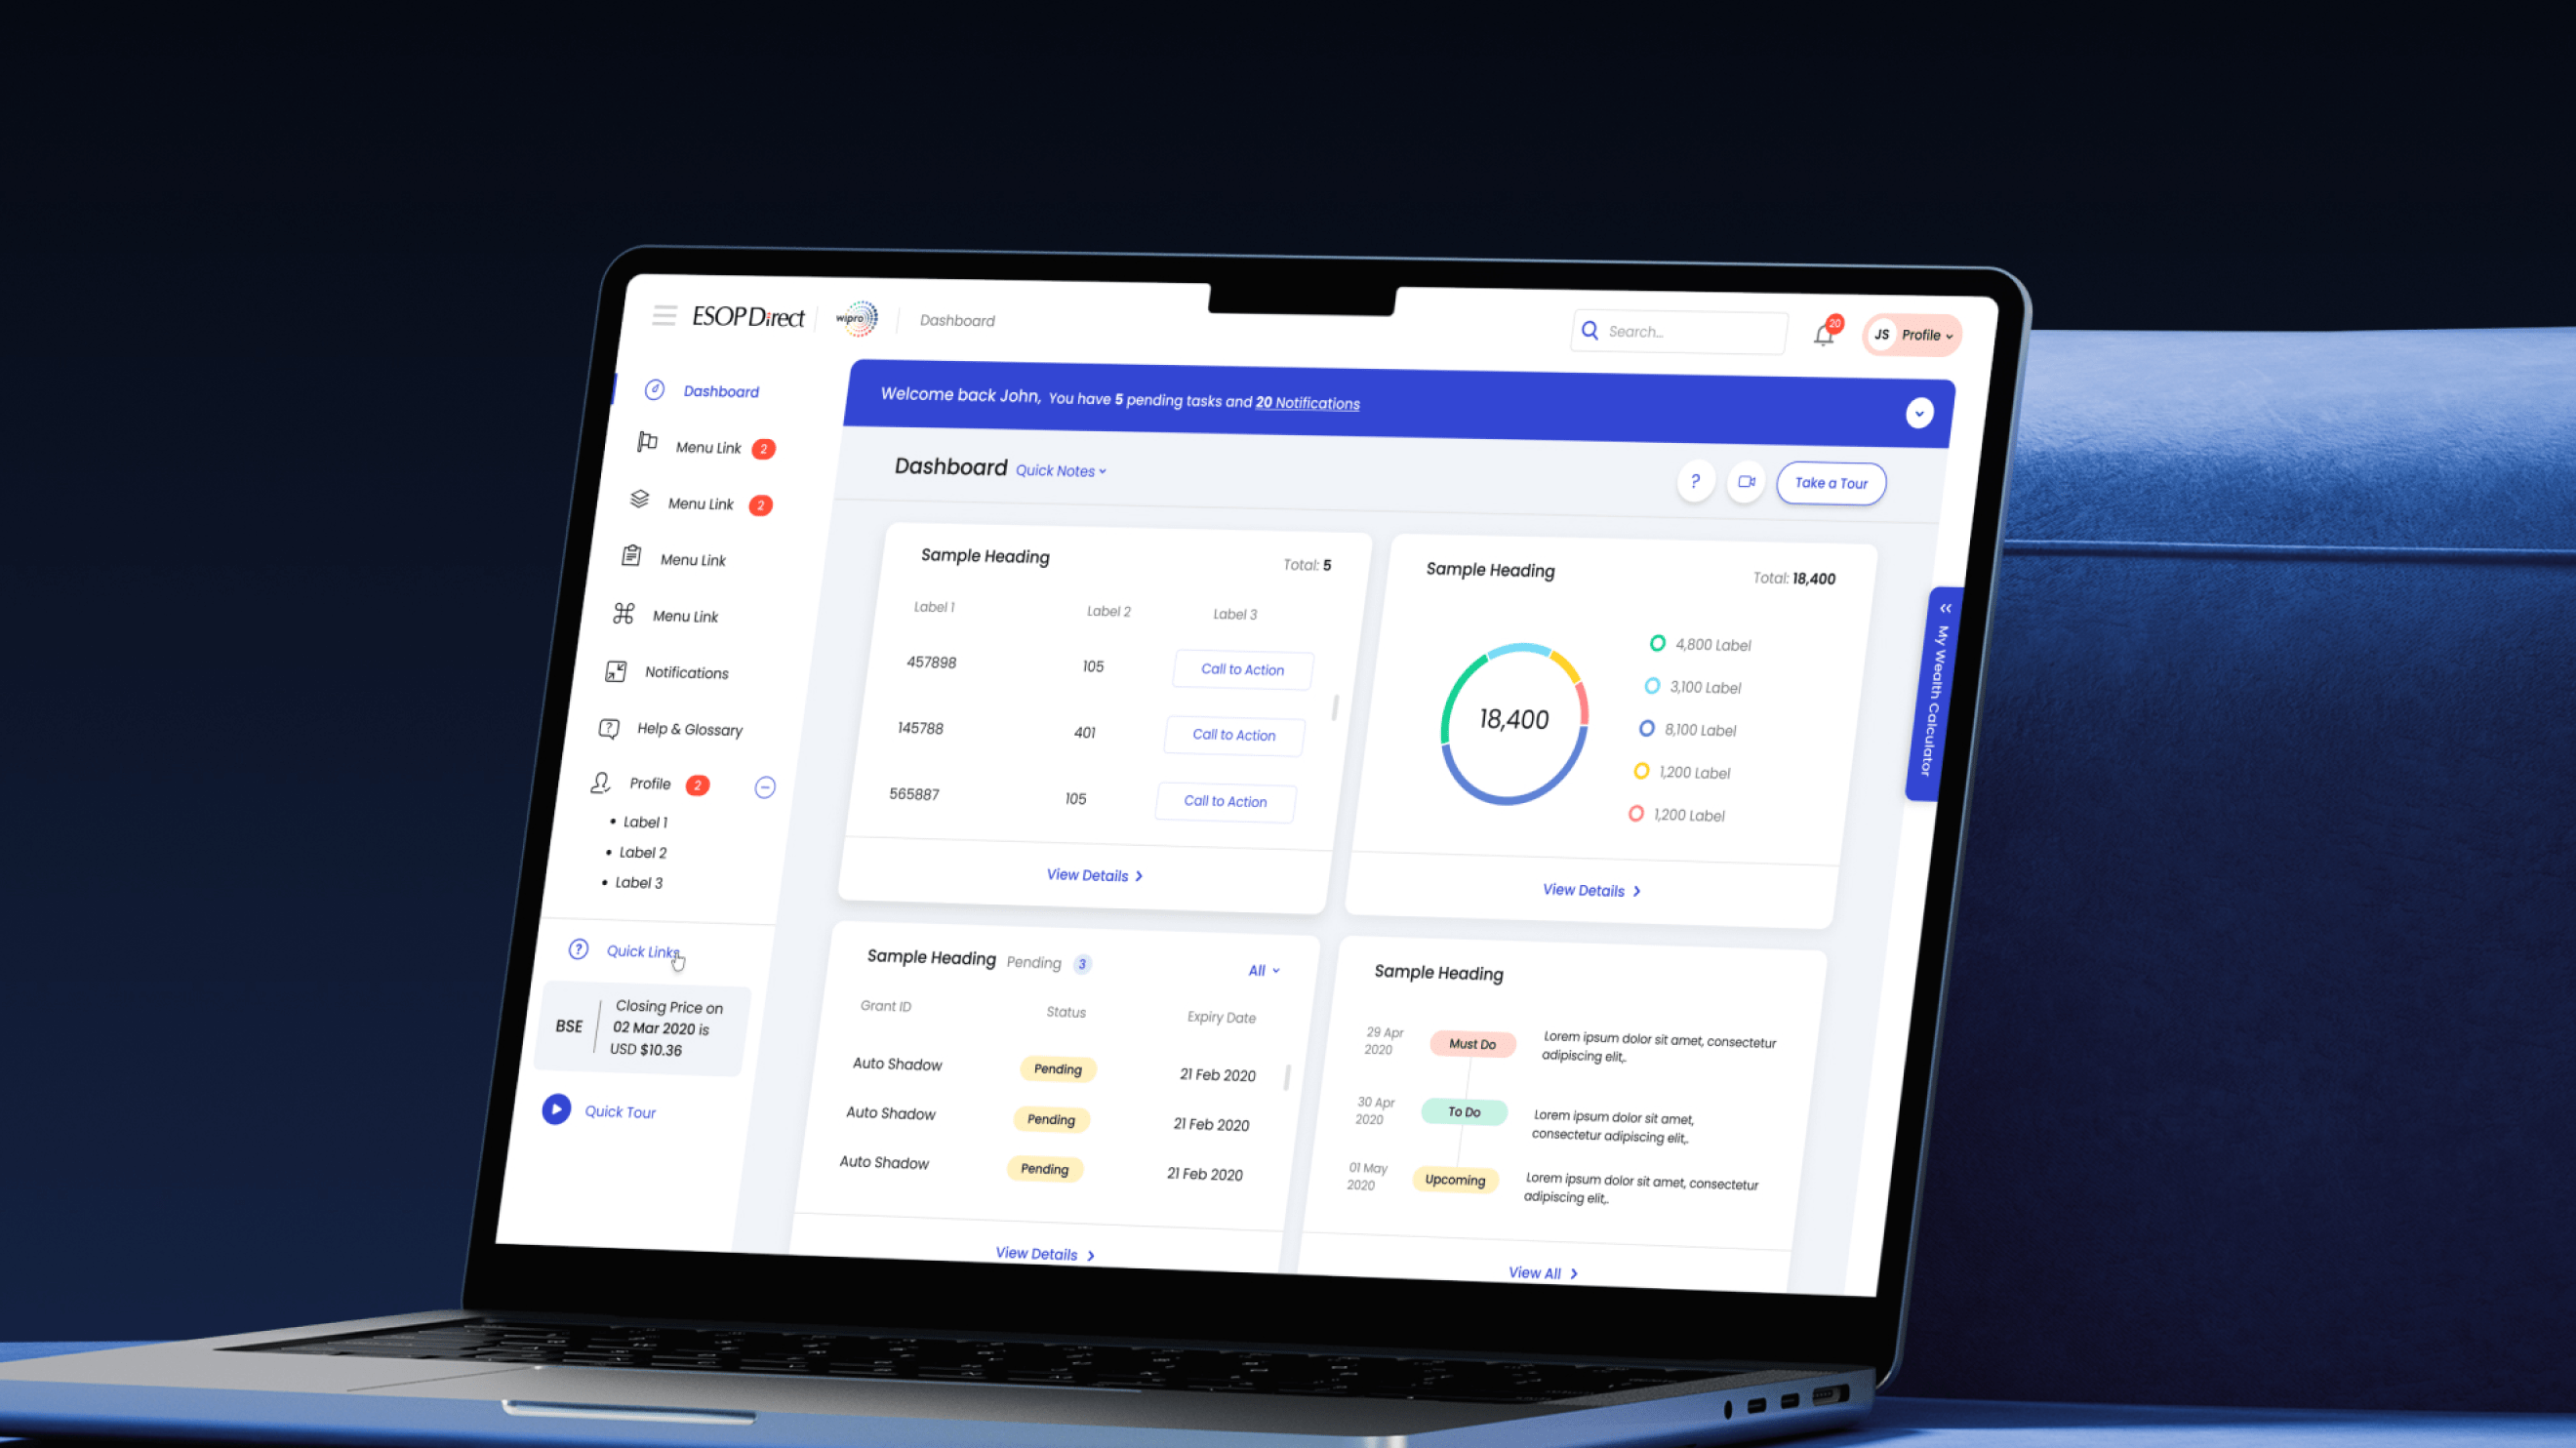
Designing intuitive, user-first interfaces in enterprise dashboard UI for effortless interaction and engagement

All our dashboard UI design, in one place

Strategic Dashboard
  • Historical Data Analysis
  • AI Predictive Analytics
  • Alerts and Notifications
  • Geospatial Mapping
  • Key Performance Indicators (KPIs)
  • Strategic Goal Tracking
  • Scenario Planning
  • Data Security
  • Dashboard Templates
Analytical Dashboard
  • Data Integration & Processing
  • Statistical Analysis
  • Data Visualization Tools
  • Hypothesis Testing
  • Collaboration Features
  • Data Annotation
  • Scenario Analysis
Operational Dashboard
  • Real-Time Data Updates
  • Resource Allocation
  • Operational Metrics
  • Workflow Integration
  • User Permissions
  • Help Center

Method that defines data design

Discover

We dive deep, understanding needs, engaging stakeholders, conducting user research, crafting personas, auditing platforms, and analysing competitors to build a strong foundation.

Define

With a clear vision, we set goals, establish KPIs, and structure information hierarchies to map out data relationships.

Strategise

A well-defined strategy drives success. We outline key objectives, success metrics, resource allocation, and milestones to ensure timely execution.

Design

From initial sketches to refined wireframes, we apply design principles that blend aesthetics with interactivity to boost engagement

Prototype & Test

We bring concepts to life by testing prototypes for usability with real-world feedback and iterative refinements.

Develop & Launch

Working closely with developers, we translate designs into responsive, high-performance digital solutions for a smooth launch

Evolve

We track performance, analyse feedback, and implement updates to keep experiences relevant and impactful.

Our recent dashboards designs

We’ve delivered  dashboard UI design services across sectors

Fintech
Ellipse
HealthTech
Ellipse
AgriTech
Ellipse
EduTech
Ellipse
Enterprise
Ellipse
Fintech
Ellipse
HealthTech
Ellipse
AgriTech
Ellipse
EduTech
Ellipse
Enterprise
Ellipse
Fintech
Ellipse
HealthTech
Ellipse
AgriTech
Ellipse
EduTech
Ellipse
Enterprise
Ellipse
Fintech
Ellipse
HealthTech
Ellipse
AgriTech
Ellipse
EduTech
Ellipse
Enterprise
Ellipse
Fintech
Ellipse
HealthTech
Ellipse
AgriTech
Ellipse
EduTech
Ellipse
Enterprise
Ellipse
Awards we won

Pushing boundaries in design innovation

Award
A Design
Award

Wins the Prestigious A’ Design Award for designing the UX UI for the Intelehealth Mobile & Web App

Clutch Top Designers
Clutch Top
Designers

In 2019, Clutch has rated us as one among the top design studios in india

Awwwards
Awwwards

Nomination for Best Web Presence created for Prismic Reflections on AWWWARDS.com

Silicon India
Silicon India

Business and Technology magazine has shortlisted us for 20 most promising UX/UI design services providers

Design India

IBDA 2020, Special Mention for UX/UI Design of Mutual Fund Investment Platform

CSSDA Nominee

Nomination for Web Presence created for Karda Construction, on CSS Design Awards 10 Oct, 2012
 Role: Concept, Art direction & Designer

IDA Design Award

Won the IDA Awards 2018 for designing the UX UI for the Authentic Web Application

Awwwards
Awwwards

NominatioIn 2010, Nomination for Best Web Presence created for Prismic Reflections, on AWWWARDS.comn for Best Web Presence created for Prismic Reflections on AWWWARDS.com

Clutch Top Designers
Clutch Top
Designers

As on 29 january 2018, Clutch as rated us as one among the top design studios in india.

CSSDA Nominee

Nomination for Web Presence for Bridgewater Nigeria LTD,CSS Design Awards 19 Dec, 2010

Digithon

Digithon Angel Broking kick-starts a 'first-ever' partner-centric  challenge to foster technology innovations won by Prismic Reflections

Design Firms

DesignFirms(TM) Web Awards by Design Firm.  Prismic Reflections has won the February 2011 DESIGNFIRMS(TM) WEB AWARD

Your questions answered

  • Why are dashboards important for businesses?

    PlusMinus
    Dashboards provide a centralized view of key metrics and data, helping businesses make informed decisions quickly and efficiently.
  • How do you ensure your dashboards are user-friendly?

    PlusMinus
    We focus on clarity, simplicity, and usability, ensuring that our dashboards are easy to navigate and interpret.
  • Can you integrate our data sources into the dashboards?

    PlusMinus
    Yes, we can integrate multiple data sources into your dashboards to provide a comprehensive view of your business metrics.
  • Can you customize dashboards to match our brand?

    PlusMinus
    Yes, we can customize the design of your dashboards to align with your brand identity, including colors, fonts, and logos.
  • What is the process for creating a dashboard?

    PlusMinus
    Our process includes understanding your business needs, defining key metrics, designing wireframes, developing the dashboard, and testing to ensure accuracy and usability.
  • Why is UX UI design important for my business?

    PlusMinus
    Good UX UI design enhances user satisfaction, increases user engagement, and can lead to higher conversion rates and customer loyalty.
  • What is your design process?

    PlusMinus
    Our design process typically includes research, wireframing, prototyping, user testing, and iteration to ensure we create the most effective design for your needs.
  • Can you redesign an existing product?

    PlusMinus
    Yes, we can analyze your current product, identify areas for improvement, and redesign it to enhance user experience and interface.
  • How long does a typical UX UI design project take?

    PlusMinus
    The timeline varies depending on the project scope, but a typical project can take anywhere from a few weeks to several months.